They had electronic telegram machines, where you'd type
They took a telegram machine and set it up so you talk to this room-sized computer via telegram.
And then nothing.
NOTHING!
Computers still are running as if they were being talked to via telegram, and everyone is maintaining a pile of shit to hide the shame that no one has made a new (successful) os in decades.
That is what a terminal is, you talking to a computer via telegram; do not treat it like magic.
This one line is 90% of the difficulty of how this project was made and I will be breaking it down slowly
And a script, using this very important bit of computer history, is when a computer pretends it sends itself a telegram. Character to character, as if a human wrote it.
It is followed by which "shell" or "telegram listener" it should send the file to.
Putting it all together, you do that hardest part of all programming, getting a computer to just even remotely consider listening to you.
15-line version
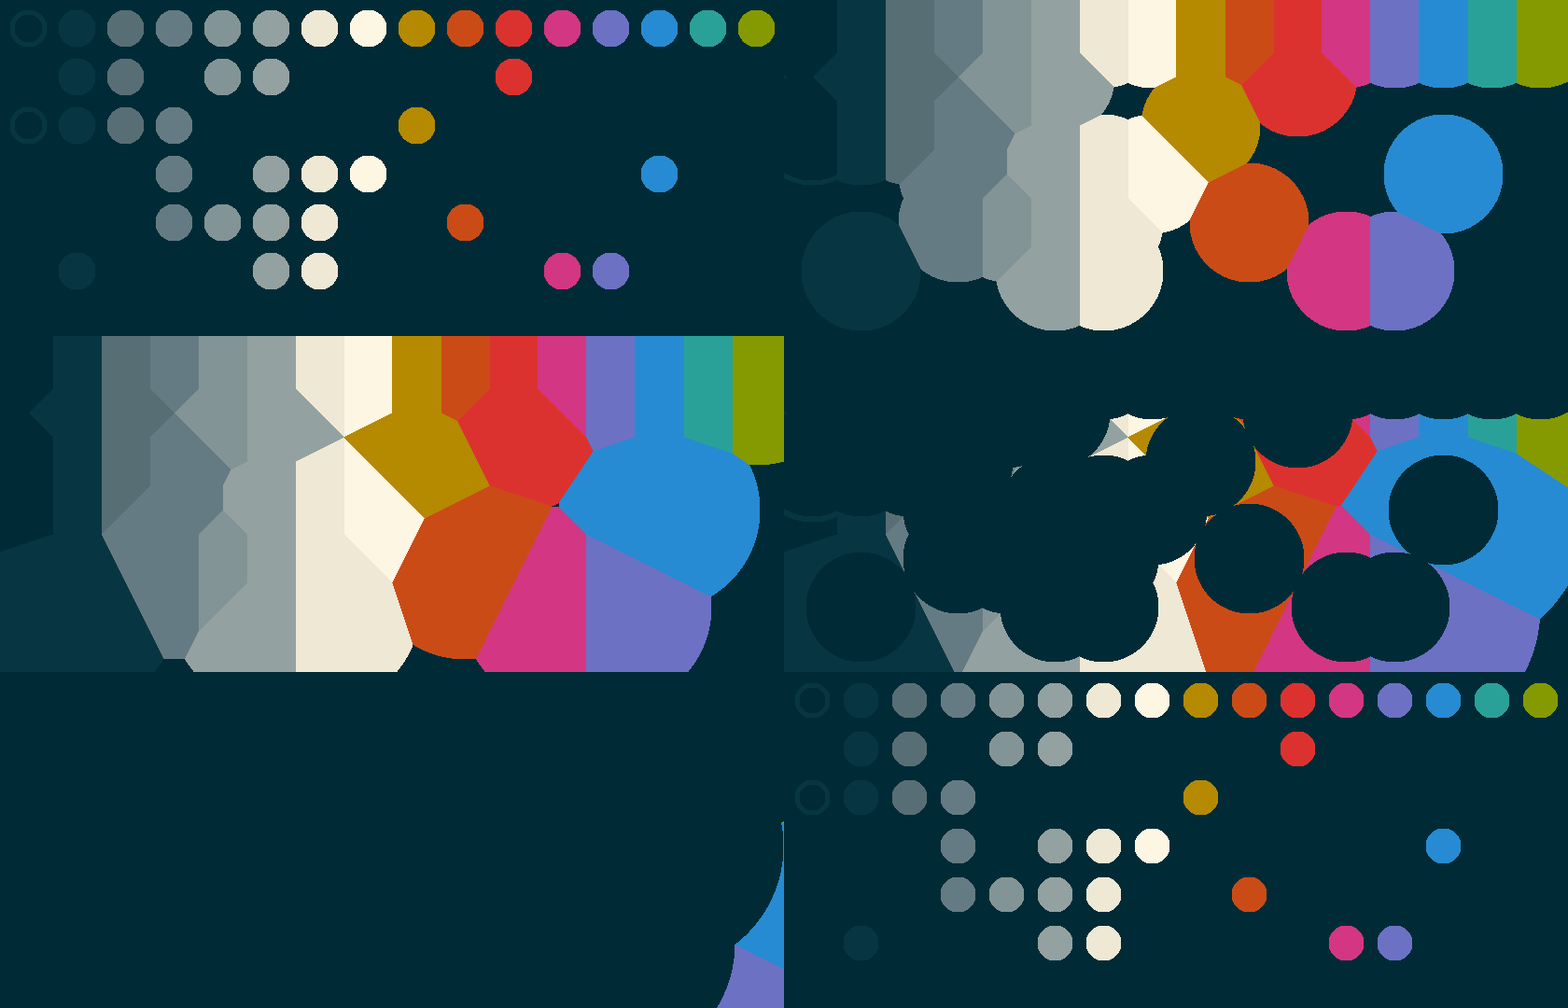
Voronoi diagrams and growing circles
To render a Voronoi diagram (in a terrible way) each pixel asks "What color is my nearest point"
To render a circle (in a terrible way), each pixel asks "How far away from the center am I" and compares it to the radius
To render a "ring" it's the same as the circle but there's a minimum radius
This all quite naturally combines, where I precomputed the color and distance for each pixel, and in each frame, the precomputed result is compared to a global min and max distances. All I needed to do was keep the min distance quite small for a long time, and well the end seemed boring I added some complexity.
Instead of a random color tho, I grabbed the color from the layer 1 Voronoi diagram to keep it consistent.
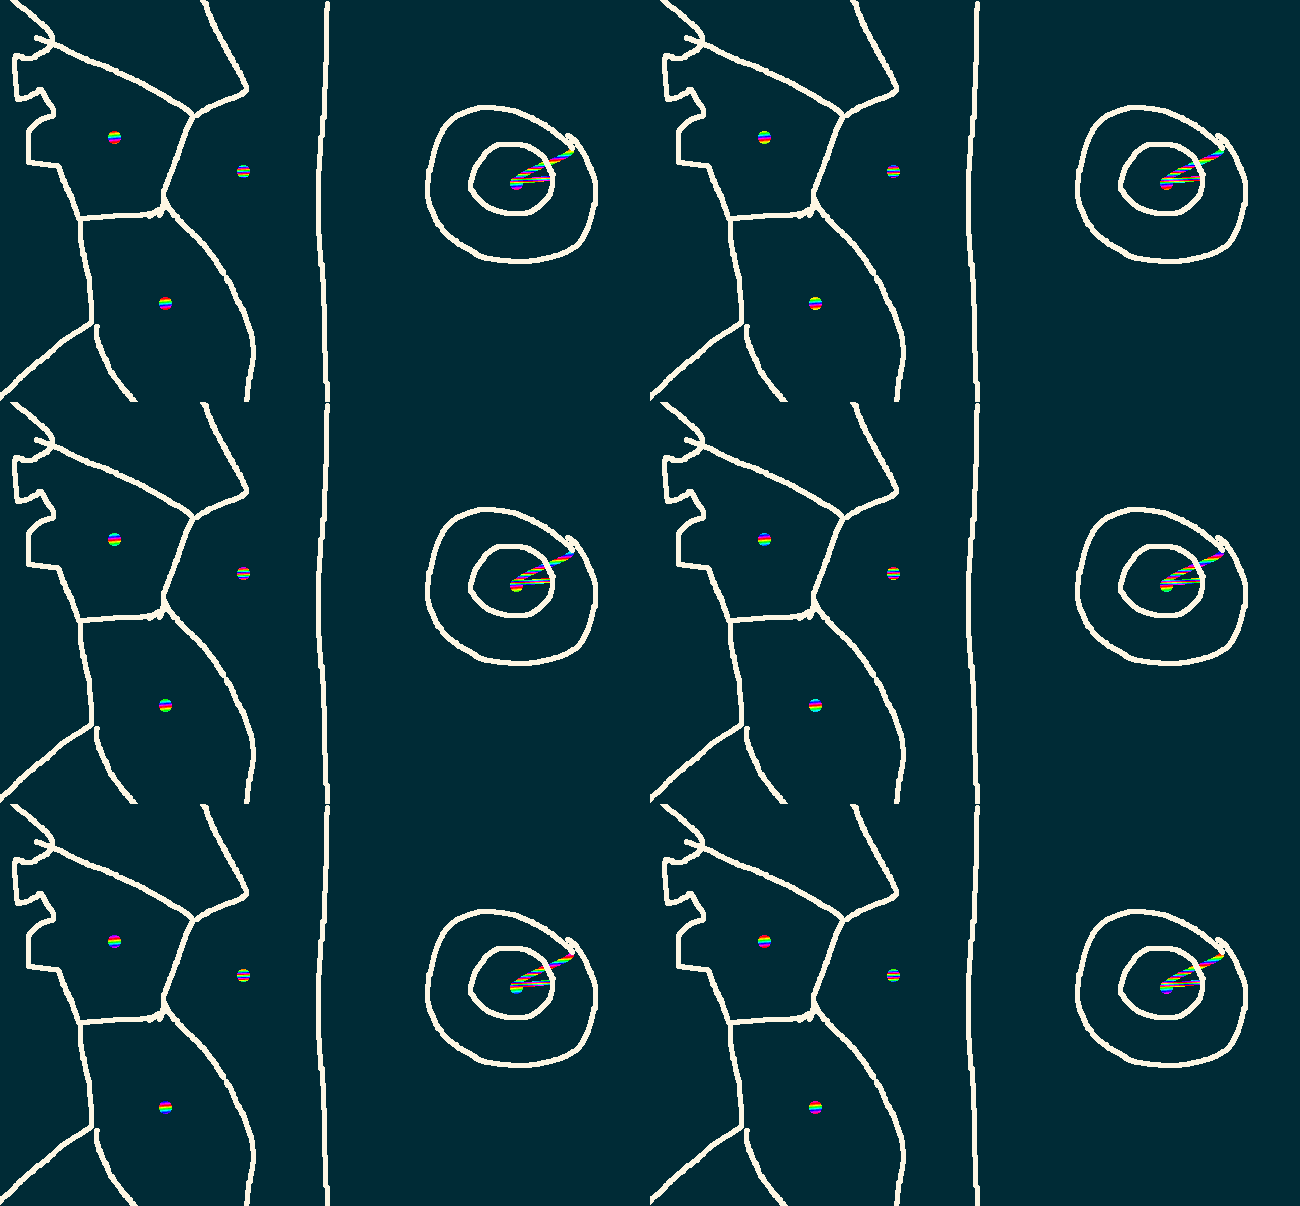
It was awful trial and error and it's this awful bit of code; so here's a helpful graph. I would like to see these sorts of things be easy to draw, I don't understand why the tool doesn't exist where you draw some lines, and you get some math out, or hell a list of values.
So gifs are a list of pictures and you can just change the timings, so I found the website https://ezgif.com/ and started deleting frames and made some key frames longer, such as the first one; giving your computer time to get a head start to download the image and getting it down to 357.8 kb
How I made my website gif — Using D
A brief history of computers user interfaces
Back when dinosaurs roamed the earth, and reality was in black a white, there was a room-sized computer and someone was deciding how to talk to it.
Breaking down the magic Linux-ism line
The first and by far most complicated line of code is
#!
This character combo, at the start of a file, tells a Linux system that this is a script.
/usr/bin/env -S sh -c
I don't know what this actually does and copy and pasted off a website :D
dmd -run gengif.d
Dmd is the basic compiler for D and '-run' makes it run, while gengif.d is the name of the file
|
A "pipe", is when the output of a program is used *drum roll* as a telegram for another program.
convert
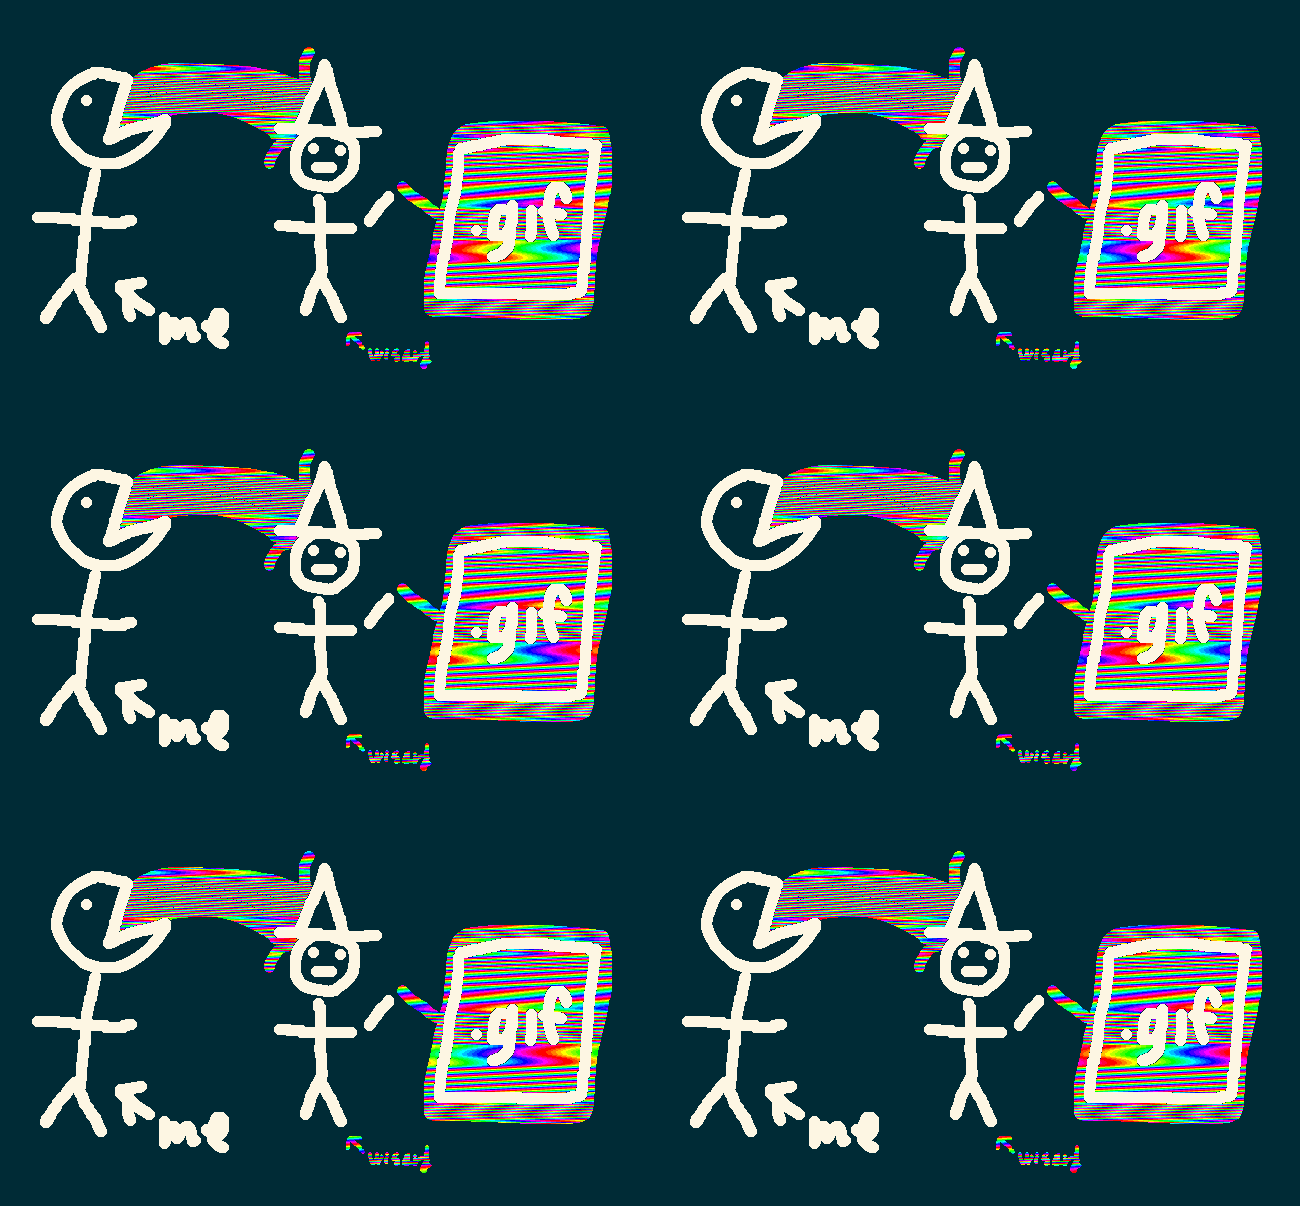
This is part of the "image magick" toolkit, I believe the part of the tool kit for converting files, maybe. So just imagine a wizard.
-size 840x360 -depth 8
"expect a image size of 840x360, and 8-bit numbers"
rgb:-
The - is magic in Imagemagick for piped input, the rgb: is overloading the data channel format.
output.gif
The output I wonder what file type.
Artist rendering of the process:

It's a well-known result that growing circles will produce a Voronoi diagram, I'm very much not breaking ground here.


Random circles alone are interesting
Using the same logic a precomputed layer of data of a distance and indexed color, circles that pop in and out are enough to make something worth looking at.

Animation is simple math, with terrible tooling
With those tools in hand, the question becomes, what to set these 4 values?

Optimizing gifs
After that was all said and done, it was still a little lifeless, and 2 megabytes, more than I want to trust will download instantly.